Share
Remember to add us to your safe senders list!
WEEKLY MARKET UPDATE
August 15, 2019
 
Check out this video explaining community solar from the New York State Energy Research and Development Authority!
Natural Gas

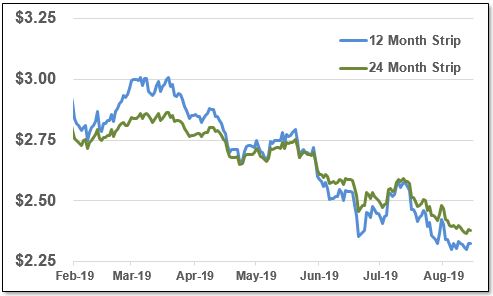
Gas futures have regained upward momentum this week after the 12 and 24 month strips reached more than 3 year lows on Monday.

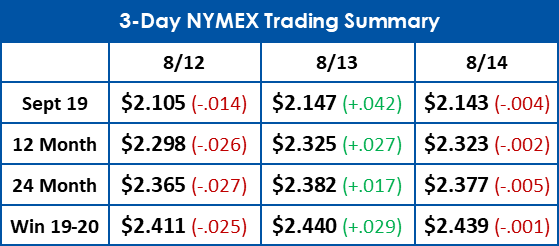
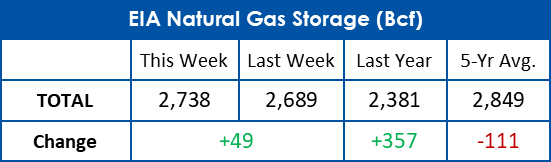
Following today's smaller than expected storage announcement, September gas rose over 10 cents. Total natural gas in storage is now at 2,738 Bcf, 357 Bcf ahead of last year.
Electricity

The 30 day average of real time power is down about $1/MWh from last week as mild weather has prevented any sustained price jumps.

Electricity futures have trickled slightly lower from last week. The 24 month strip is down 50 cents from last week to $31.29/MWh.
 
 
12 & 24 Month NYMEX Strip
12 & 24 Month Zone A Power Strip


This document is intended for indicative purposes only. All information contained within this report is acquired from third party sources and EnergyMark makes no representations or warranties, express or implied, as to the accuracy of the information provided herein. EnergyMark is not liable for any actions or decisions made in reliance on the information provided in the report.
From July 15 through July 22, 2019, a heat wave extending from the Midwest to the Atlantic coast brought extremely high temperatures and humidity to those regions. The high temperatures resulted in elevated demand for electricity to power air conditioners, dehumidifiers, fans, and other cooling equipment. In the hour ending at 6:00 p.m. ET on Friday, July 19, hourly electricity demand in the Lower 48 states peaked at 704 gigawatts (GW).
Demand for electricity was relatively high throughout each day of the heat wave. Typically, electricity demand in the summer is highest midday or in the late afternoon and lowest in the middle of the night. On a typical summer night, electricity demand for the Lower 48 states is usually lower than 400 GW, but during the heat wave, nighttime electricity demand remained between 430 GW and 450 GW. For this reason, more power generating plants operated continually during the heat wave.

Read the full article here

 
WEATHER WATCH
 
NOAA 8-14 Day Outlook
NOAA 30 Day Outlook


Email Marketing by ActiveCampaign