Share
Remember to add us to your safe senders list!
WEEKLY MARKET UPDATE
August 22, 2019
Natural Gas

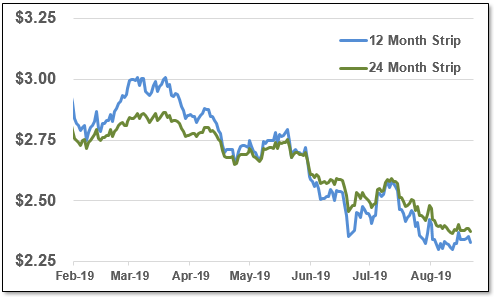
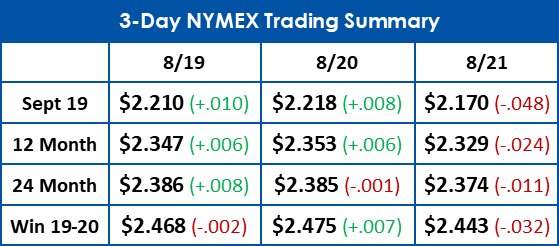
After rebounding back over $2.20/MMBtu, September futures are trending back down, falling around 5 cents in the last two days.

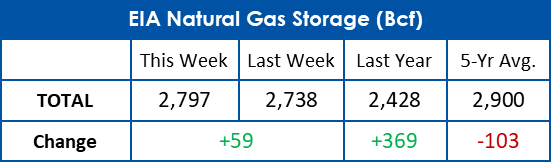
Today's storage injection puts gas in storage just 4% behind the five year average. At the start of this spring inventories were 30% behind the five year average.
Electricity

The 30 day average of real time power is down slightly from last week as mild weather has continued to depress prices.

Electricity futures continue to fall lower from last week. The 24 month strip is down 20 cents from last week to $31.09/MWh.
 
 
12 & 24 Month NYMEX Strip
12 & 24 Month Zone A Power Strip


This document is intended for indicative purposes only. All information contained within this report is acquired from third party sources and EnergyMark makes no representations or warranties, express or implied, as to the accuracy of the information provided herein. EnergyMark is not liable for any actions or decisions made in reliance on the information provided in the report.
U.S. natural gas production continued to increase in August despite relatively low natural gas spot prices, setting a new daily production record of 92.1 billion cubic feet per day (Bcf/d) on August 5, 2019.
The northeastern region continues to be the largest natural gas-producing region in the country, accounting for 34% of the U.S. total.
Record levels of natural gas production growth continue to put downward pressure on prices. This summer, prices have continued to decline despite high levels of natural gas exports and increased consumption in the electric generation sector. Prices averaged $2.40/MMBtu in June and $2.37/MMBtu in July as growth in natural gas production continued to offset growth in consumption.
Natural gas storage has been absorbing a significant amount of this production. This injection season started with working natural gas inventories 30% lower than the previous five-year (2014–18) average during the same period. By the week ending August 9, working gas inventories were at 111 Bcf, or 4%, lower than the five-year average of 2,849 Bcf.

Read the full article here
 
WEATHER WATCH
 
NOAA 8-14 Day Outlook
NOAA 30 Day Outlook
 
Check out this video explaining community solar from the New York State Energy Research and Development Authority!


Email Marketing by ActiveCampaign