Share
Remember to add us to your safe senders list!
WEEKLY MARKET UPDATE
September 5, 2019
Natural Gas

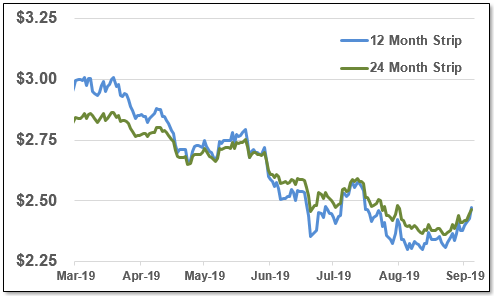
Natural gas futures continue to climb after remaining at 3 year lows for several weeks. The 12 month strip is up over 15 cents in the last two weeks.

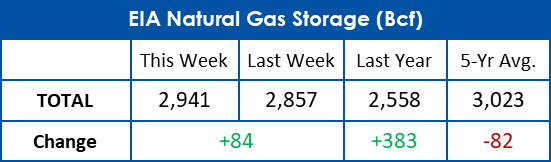
A larger than anticipated injection created a short-lived fall in the market. Total gas in storage is now 383 Bcf ahead of last year.
Electricity

The 30 day average price of real time power has fallen over $2/MWh from last week with more mild temperatures.

Electricity futures rebounded following the rise in gas prices. The 12 month strip is up nearly $1/MWh from this time last week.
 
 
12 & 24 Month NYMEX Strip
12 & 24 Month Zone A Power Strip


This document is intended for indicative purposes only. All information contained within this report is acquired from third party sources and EnergyMark makes no representations or warranties, express or implied, as to the accuracy of the information provided herein. EnergyMark is not liable for any actions or decisions made in reliance on the information provided in the report.

According to 2017 data from the U.S. Energy Information Administration (EIA) for newly constructed utility-scale electric generators in the United States, annual capacity-weighted average construction costs for solar photovoltaic systems continued to decrease.
[Solar, wind and natural gas] accounted for more than 97% of total capacity added to the grid in the United States in 2017. Since 2013, average costs for solar photovoltaic generators have fallen by 37%, wind by 13%, and natural gas by 4.7%. Total investment in U.S. electric generating capacity in 2017 decreased by 27% from the previous year.
Solar photovoltaic generators generally cost more to install than wind and natural gas generators on a dollar-per-kilowatt basis. Solar photovoltaic generators accounted for a larger share of all new electricity generation construction costs in the United States in 2017, accounting for 37% of total investment. In 2017, U.S. developers spent nearly $12 billion in construction costs on solar photovoltaic plants and added 5.0 gigawatts (GW) of electricity generating capacity. By comparison, U.S. developers invested less in constructing natural gas and wind generators, but they still added 10.5 GW and 5.8 GW of capacity from those sources, respectively.

Read the full article here
 
WEATHER WATCH
 
NOAA 8-14 Day Outlook
NOAA 30 Day Outlook
 
Check out this video explaining community solar from the New York State Energy Research and Development Authority!


Email Marketing by ActiveCampaign