Share
Remember to add us to your safe senders list!
WEEKLY MARKET UPDATE
September 20, 2019
Natural Gas

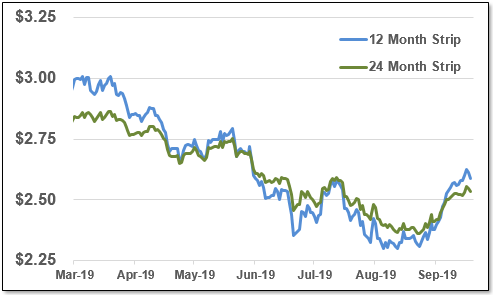
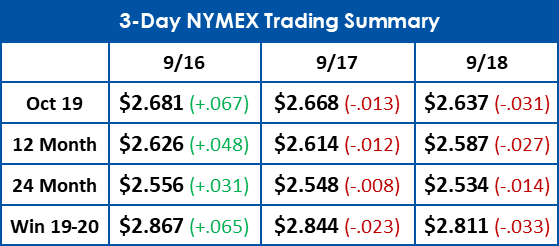
After two down days and a larger than anticipated injection of gas into storage, October 2019 contracts have fallen over 10 cents.

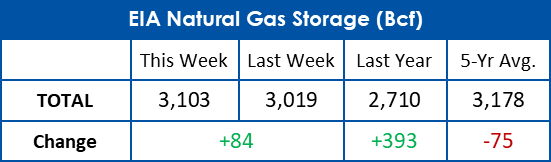
After yesterday's injection of 84 Bcf, total gas in storage is now 3,103 Bcf, 12% higher than this time last year.
Electricity

The 30 day average price of real time power has fallen more than $3/MWh since lat week, now down to $20.74.

Electricity futures are down from last week. The 12 month strip is down $1.83/MWh, the lowest it has been since May of 2018.
 
 
12 & 24 Month NYMEX Strip
12 & 24 Month Zone A Power Strip


This document is intended for indicative purposes only. All information contained within this report is acquired from third party sources and EnergyMark makes no representations or warranties, express or implied, as to the accuracy of the information provided herein. EnergyMark is not liable for any actions or decisions made in reliance on the information provided in the report.
U.S. natural gas production continued to increase in August, setting a new daily production record of 92.8 billion cubic feet per day (Bcf/d) on August 19, 2019, according to estimates from IHS Markit. Natural gas production also set a new monthly record in August, averaging more than 91 Bcf/d for the first time. In the latest Short-Term Energy Outlook (STEO), released on September 10, 2019, the U.S. Energy Information Administration (EIA) forecasts dry natural gas production to average 93.4 Bcf/d from September through the end of the year. U.S. natural gas production increased by 7.1 Bcf/d (8%) between August 2018 and August 2019, led by production gains primarily in the Northeast.
U.S. natural gas production has increased, even as natural gas prices have declined. Natural gas spot prices at the national price benchmark Henry Hub have been on a downward trend since early spring. Spot prices at other natural gas hubs across the country have continued to sell at discounts to Henry Hub.
Natural gas storage has been absorbing a significant amount of the increase in U.S. production. Working natural gas inventories in the Lower 48 states began the injection season (April 1) about 30% lower than the previous five-year (2014–18) average level for that time of year. By the week ending August 30, 2019, working natural gas inventories were just 3% lower than the five-year average for that time of year.

 
WEATHER WATCH
 
NOAA 8-14 Day Outlook
NOAA 30 Day Outlook
 
Check out this video explaining community solar from the New York State Energy Research and Development Authority!


Email Marketing by ActiveCampaign