Share
Preview
Remember to add us to your safe senders list!
WEEKLY MARKET UPDATE
February 8, 2018
Natural Gas

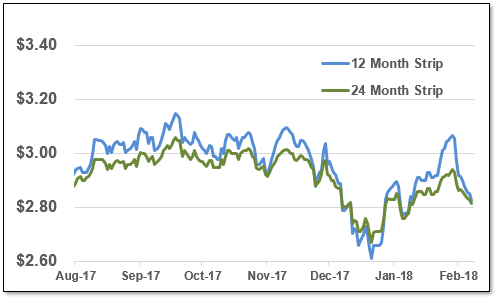
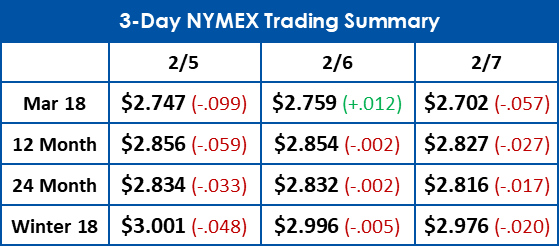
March 2018 futures have fallen nearly 50 cents since taking over as the prompt month.

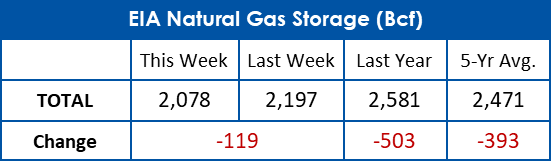
The 12 month strip has fallen roughly 25 cents in the last 10 days down to $2.83/MMBtu. Today's storage report of a 119 Bcf withdrawal brought gas in storage to 2,078 Bcf, now 503 Bcf less than last year's levels.
Electricity

The 30 day average price of power is down over $25/MWh from last week as real-time power prices continue to be low so far in February.

The futures strips continued to fall this week after last week's big drop. The 12 month strip is down another 75 cents to $29.52/MWh.
 
 
12 & 24 Month NYMEX Strip
12 & 24 Month Zone A Power Strip


This document is intended for indicative purposes only. All information contained within this report is acquired from third party sources and EnergyMark makes no representations or warranties, express or implied, as to the accuracy of the information provided herein. EnergyMark is not liable for any actions or decisions made in reliance on the information provided in the report.
 
As one of the first technologies used to generate electricity, hydroelectric power has historically provided the largest share of renewable electricity generation in the United States. However, this year EIA expects wind power to surpass hydroelectricity, based on forecasts in the latest Short-Term Energy Outlook. Different factors lead to uncertainty about the forecast level of electricity generation from each energy source.
Because few new hydro plants are expected to come online in the next two years, hydroelectric generation in 2018 and 2019 will largely depend on precipitation and water runoff. Although changes in weather patterns also affect wind generation, the forecast for wind power output is more dependent on the capacity and timing of new wind turbines coming online.
EIA expects significant levels of new wind capacity to come online in 2018 and 2019, similar to the trend in recent years. EIA’s most recent Preliminary Monthly Electric Generator Inventory survey shows wind capacity increasing by 8.3 gigawatts (GW) in 2018 and 8.0 GW in 2019. If these new generating units come online as scheduled, they would add 9% to U.S. utility-scale wind capacity by the end of 2018 and another 8% by the end of 2019.

Read the full article here
WEATHER WATCH
 
NOAA 8-14 Day Outlook
NOAA 30 Day Outlook


Email Marketing by ActiveCampaign