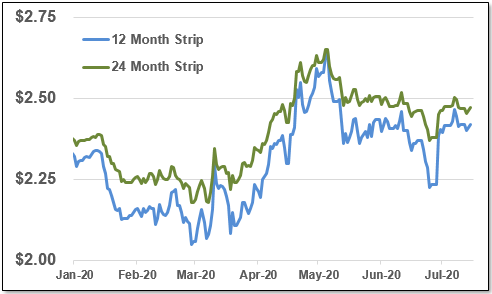
Share
Preview
Remember to add us to your safe senders list!
WEEKLY MARKET UPDATE
July 16, 2020
Natural Gas

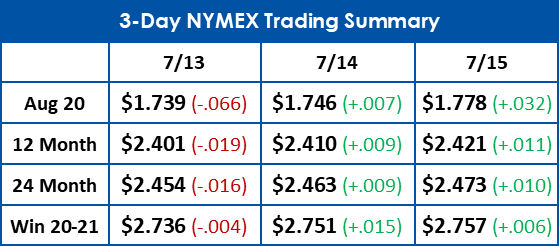
Natural gas futures have slipped backwards after a strong recovery in weeks prior. August 2020 contracts are down 4.6 cents from last week.

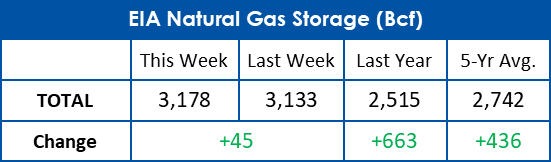
Today's injection of 45 Bcf of gas into storage was lower than expected and brought total gas in storage to 16% above the 5 year average.
Electricity

The 30 day average price of real time power continues to climb with summer cooling demand, up nearly another $3/MWh from 2 weeks ago.

Power futures keep slowly creeping upward. The 12 month strip is up another 26 cents from last week to $27.62/MWh.
 
 
12 & 24 Month NYMEX Strip
12 & 24 Month Zone A Power Strip


This document is intended for indicative purposes only. All information contained within this report is acquired from third party sources and EnergyMark makes no representations or warranties, express or implied, as to the accuracy of the information provided herein. EnergyMark is not liable for any actions or decisions made in reliance on the information provided in the report.
According to the U.S. Energy Information Administration’s (EIA) March and April Preliminary Monthly Electric Generator Inventory data, COVID-19 mitigation efforts have resulted in slightly more delays than average in the commercial operation dates of proposed electric generator projects. Based on the average of delays reported in 2018 and 2019, about 20% of the projects scheduled to come online in the next 12 months experienced some delay. In March and April 2020, 21% and 29% of projects, respectively, experienced delays, some of which were attributed to efforts to prevent the spread of COVID-19.
In March 2020, 163 of the 772 proposed generating units delayed their operational date, with 41 citing COVID-19 as a reason for delay. Of the 746 generating units reporting in April, 220 were delayed and 67 of these reported COVID-19 as a reason. The delays attributed to COVID-19 during these two months represent 3.1 gigawatts (GW) of capacity, or 18% of total delayed capacity. The median delay was two months, regardless of whether or not COVID-19 was cited as the cause of delay.

Read the full article here
 
WEATHER WATCH
 
NOAA 8-14 Day Outlook
NOAA 30 Day Outlook


Email Marketing by ActiveCampaign