Share
Preview
Remember to add us to your safe senders list!
WEEKLY MARKET UPDATE
October 22, 2020
Natural Gas

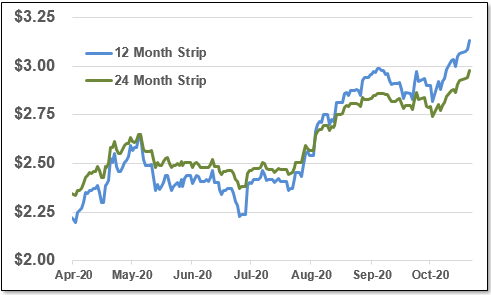
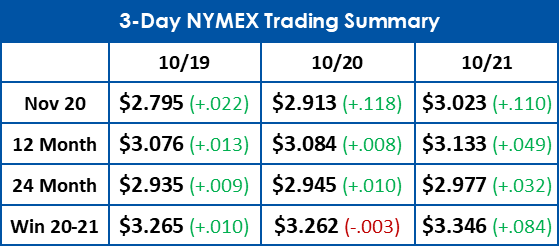
November 2020 gas eclipsed $3/MMBtu yesterday after 3 straight days of movement upwards. This is the first time the prompt month has settled above $3 since January 25th 2019.

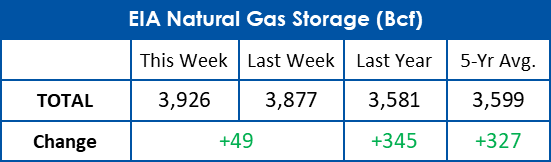
Today's injection of 49 Bcf was slightly smaller than anticipated. Total gas in storage is now only 9% above the 5 year average.
Electricity

Real time power prices have stayed steady in the last two weeks. The 30 day average has stayed below $16/MWh for several weeks now.

The 12 month electric futures strip continues to bounce back and forth just below the $30/MWh threshold, now at $29.66/MWh.
 
 
12 & 24 Month NYMEX Strip
12 & 24 Month Zone A Power Strip


This document is intended for indicative purposes only. All information contained within this report is acquired from third party sources and EnergyMark makes no representations or warranties, express or implied, as to the accuracy of the information provided herein. EnergyMark is not liable for any actions or decisions made in reliance on the information provided in the report.
In 2019, consumption of renewable energy in the United States grew for the fourth year in a row, reaching a record 11.5 quadrillion British thermal units (Btu), or 11% of total U.S. energy consumption.
In its Monthly Energy Review, EIA converts sources of energy to common units of heat, called British thermal units (Btu), to compare different types of energy that are more commonly measured in units that are not directly comparable, such as gallons of biofuels compared with kilowatthours of wind energy.
Solar energy, consumed to generate electricity or directly as heat, accounted for about 9% of U.S. renewable energy consumption in 2019 and had the largest percentage growth among renewable sources in 2019.

Read the full article here
 
WEATHER WATCH
 
NOAA 8-14 Day Outlook
NOAA 30 Day Outlook


Email Marketing by ActiveCampaign