Share
Preview
Remember to add us to your safe senders list!
WEEKLY MARKET UPDATE
January 7, 2021
Natural Gas

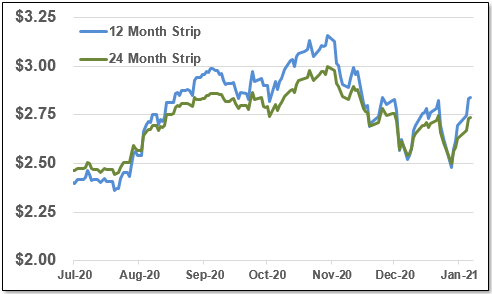
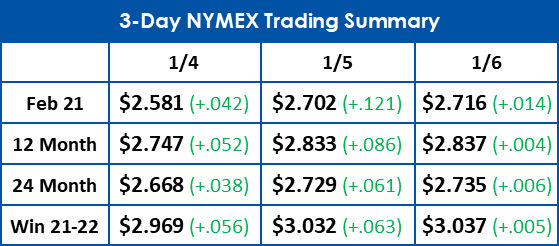
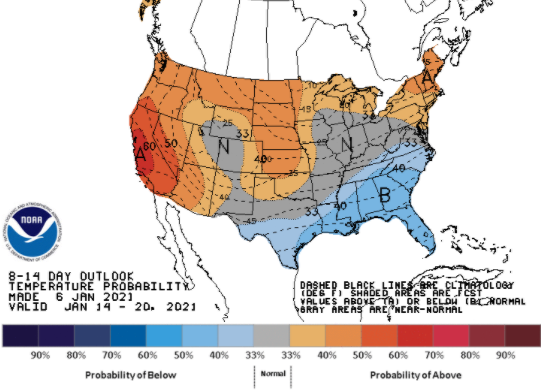
Natural gas futures made a strong push this week on colder expected weather in the near term. February 2021 is up over 17 cents this week.

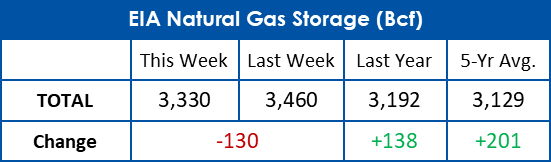
This week's storage report showed a smaller withdrawal than was anticipated. After the 130 Bcf withdrawal, total gas in storage is now 6% above the 5 year average.
Electricity

Real time power prices are trending slightly higher the past several weeks. The 30 day average is up to $23.03/MWh.

Electricity futures are up slightly from last week after nearly breaking back below $25/MWh to close out 2020. The 12 month strip is now at $26.43/MWh.
 
 
12 & 24 Month NYMEX Strip
12 & 24 Month Zone A Power Strip


This document is intended for indicative purposes only. All information contained within this report is acquired from third party sources and EnergyMark makes no representations or warranties, express or implied, as to the accuracy of the information provided herein. EnergyMark is not liable for any actions or decisions made in reliance on the information provided in the report.
In 2020, natural gas spot prices at the national benchmark Henry Hub in Louisiana averaged $2.05 per million British thermal units (MMBtu), the lowest annual average price in decades. Prices started the year relatively low because mild winter weather led to less natural gas demand for space heating. Prices remained low as economic effects induced by the COVID-19 pandemic reduced both natural gas production and consumption.
Beginning in March, spring weather and responses to COVID-19 drove down natural gas demand, further lowering prices. The Henry Hub price averaged $1.66/MMBtu in June, the lowest monthly price in decades. Prices increased in the second half of the year because of lower natural gas production and an increase in liquefied natural gas (LNG) exports.
Natural gas consumed to generate electric power in the United States reached a record high, averaging 31.6 billion cubic feet per day (Bcf/d) in 2020, or 2% more than the 2019 average. This increase occurred despite slightly lower total U.S. electricity consumption this year. Natural gas consumed by electric power plants set a daily record high of 47.2 Bcf at the end of July, according to S&P Global Platts estimates, because of record-high summer temperatures and low summer prices.

Read the full article here
 
WEATHER WATCH
 
NOAA 8-14 Day Outlook
NOAA 30 Day Outlook


Email Marketing by ActiveCampaign